If you get info on your photos you have taken with your iPhone, you can find out where you took the image, the time, if you used a flash, what app you used and much more. All you have to do is go through each photo to see that information.
Or, you can use a new app to analyze all of the photos on your iPhone and create a Infographic to show you all that data through graphic images. Photo Stats Infrographic Creator is that app which gives a fun view to that data you normally have to dig for.
The data collected is for photos on your iPhone only, in my case that is a few saved folders from trips and events, a Photo Stream (max 1000 photos) folder and the main big iPhone Photo default library
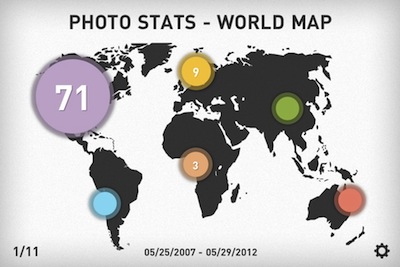
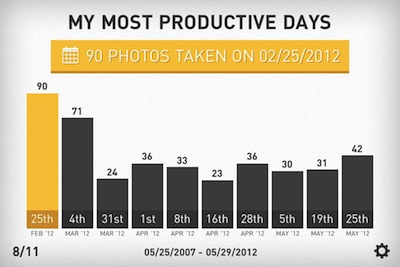
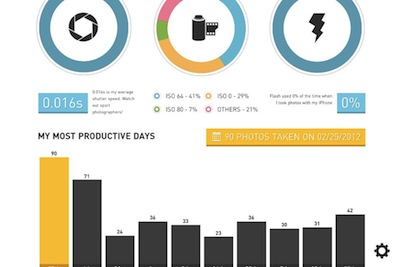
Notice the number in the lower left corner, showing that there are 11 information graphics created by me and the Photo Stats Infographic app. My part was waiting a few minutes as the app went through all of the photos, barely enough time to grab a cup of coffee! Looking at the graphic below, I need to go back and see where I was on Feb 25th!
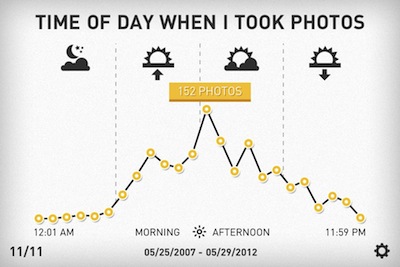
It would appear that Photo Stats says I spend most of my time taking photos in the middle of the day. Makes sense since I shoot a lot on my daily lunch walk.
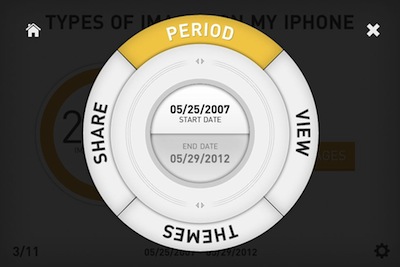
Choose the settings gear in the lower right corner to get to a few fine tuning options. Turn the circle to get to the options, the upper most is the one your adjusting. Period is for start/finish photo dates, Share is for sharing your infographic to social services, Themes has a couple options to customize the look and finally ‘View’ is how the graphics layout.
If you choose the ‘View’ option, you can have the data appear side-by-side to swipe through or all of the data stacked, which makes more sense if your going to share for others to view. Photo Stats Infographic Creator a must have app I’ll use every day? No, but it will be fun to use from time-to-time to get an overview of the photos I have on my iPhone.
